2.2 Environmental Quality
Industrial pollution decreased throughout European transition countries when output fell. With resumed economic growth, this trend could be reversed if no effective countermeasures are taken. Structural change from heavy to light industry and to services, together with improved resource efficiency, help to counteract that threat.
In many cases, no recent quantitative data are available. But the data summarised here give an indication of different starting or interim points and trends observed in different countries.
Energy efficiency in CEE, measured as energy use per unit of GDP, was considerably below that of Western Europe.
There is a clear trend towards an improvement of energy efficiency, e.g. through combined heat and power installations. Transition countries still have a potential to counteract growing energy consumption in the transport sector, by reviving their public transport systems. Improvements in energy efficiency seem to go hand in hand with higher tariff rates.
|
Development of CO2, NOx and SO2 emissions in the BSR 1990-1997 and target levels 2015
|
|
|
Source: prepared on the basis of information collected by Baltic21
Note: 2015 target: Ceilings according to the Long Range Transboundary Protocol (1999)
|
The share of renewable energy in total energy consumption in the BSR is slowly growing, from approx. 6% in 1990 to close to 8% in 1997.
No similar trend is observed for electricity where the share of renewable electricity fluctuates around 20%.
Air pollution
The levels of air pollution show a slight (CO2, NOx) to clear (SO2) downward trend.
Policy measures for reducing greenhouse gas emissions in the EU countries of the BSR refer to increased energy/CO2 taxation, support for renewable energy production (biomass, wind farms), gas-fired power plants, high-yield power plants, public heating.
Emissions levels of CO2 per capita are likely to rise from mobile sources parallel to trend in energy consumption, changes in lifestyle and rise in private car ownership.
In comparison with the Nordic countries, Latvia and Lithuania have low CO2 emissions per capita and high CO2 emissions per unit of GDP, which is typical of countries in transition.
SO2 per capita is highest in Estonia, which is largely due to emissions from the oil shale industry.
|
BSR nitrogen riverine inputs and discharge from point sources to the Baltic Sea (1995)
|

|
|
|
Source: Baltic 21, Series No.2/2000 based on data from: HELCOM, The thirds Baltic Sea Pollution Load Compilation, 1998.
Definition: The load includes diffuse leakage and discharges from point sources up-streams the rivers.
Notes: Data include only Baltic Sea catchment area. Data are not complete.
|
NOx emissions per capita are substantially lower in Estonia, Latvia, Lithuania and Poland than in the Nordic countries. CO2 emissions per capita in Latvia and Lithuania are approximately half of that of the Nordic Countries, but the levels are highest in Estonia.
In the Baltic States, the emission levels of CO2, SO2 (from stationary sources), NOx (from stationary and mobile sources) and dust from stationary sources decreased slightly since 1994 15. This development is on par with the evolution in the western part of the BSR, for example in Finland the NOx emissions decreased by 8% from 1994 - 1997 and CO2 emissions rose marginally during the same period in the Baltic States.
In Belarus, the majority of emissions are from mobile sources, 71% of total NOx emissions of 179,8 tonnes in 1998 were from mobile sources, 92% of CO emissions (total 1077,2 tonnes in 1998) and 26% of SO2 emissions (total 208,2 tonnes). Main stationary sources of pollution were from heat and power plants and industrial processes.
Water pollution
The Baltic Sea is the largest body of brackish (low salinity) water in the world, with low water circulation and narrow links to the North Sea and Atlantic Ocean. Rivers bring polluting substances the Baltic Sea.
Challenges regarding nature and environment
- Link protection with development;
- Channel pressure from development of human activities on nature;
- Counteract the trend for growing transport on roads; enhance more environment friendly transport modes;
- Promote coordinated spatial development policies across administrative levels;
- Promote the networking of valuable nature areas to counteract fragmentation;
- Make more use of financial instruments to support valuable nature areas;
- Develop natural and cultural heritage together
|
| Pollution load from point sources, 1992 and 1996 (kg per capita) |
| |
Estonia |
Latvia |
Lithuania |
| 1992 |
1996 |
1992 |
1996 |
1992 |
1996 |
| BOD7 |
11.8 |
2.9 |
8.9 |
3.6 |
8.5 |
4.5 |
| Ntot |
3.7 |
2.2 |
1.5 |
1.5 |
2.8 |
1.7 |
| Ptot |
0.44 |
0.21 |
0.27 |
0.23 |
0.38 |
0.26 |
| Source: Baltic State of the Environment Report, Baltic Environmental Forum 1998. |
15 million people live within 10 km from the coast (EEA, 1999) and there is a great pressure from urban settlement, industrial, commercial and transport and tourism on the coast. This has led to loss of nature character of the coast, wetlands, forests and semi-natural land, lagoons and estuaries. Activities in the drainage basin have impacts on the quality of the Baltic Sea.
Leaching from agriculture is responsible for nutrient load entering the Baltic Sea, and leads to eutrophication. Eutrophication affects almost all parts of the Baltic Sea. Blooms of harmful algae have resulted in losses of marine biodiversity and sea bird poisoning, as well as economic losses to the fish farming industry. Urban wastewater adds emissions of Phosphorus (Ptot) and BOD loads. Nitrate emissions have led to excessive concentration in drinking water causing human health problems.
In the EU, levels of (Ntot) and (Ptot) have decreased due to changes in agricultural practices and pollution controls. In the Baltic States there was a substantial decrease in pollution loads from point sources during 1992-1996. Most significant changes were in Estonia, with BOD7 being reduced to 25% of the 1992 level, and Ntot and Ptot to 50%. This is due to the installation of new biological-chemical wastewater plants. In Latvia, discharges of waste water into surface waters decreased by 47% from 1994-1998.
Concentration of heavy metals in the Baltic is much higher than in the North Sea.
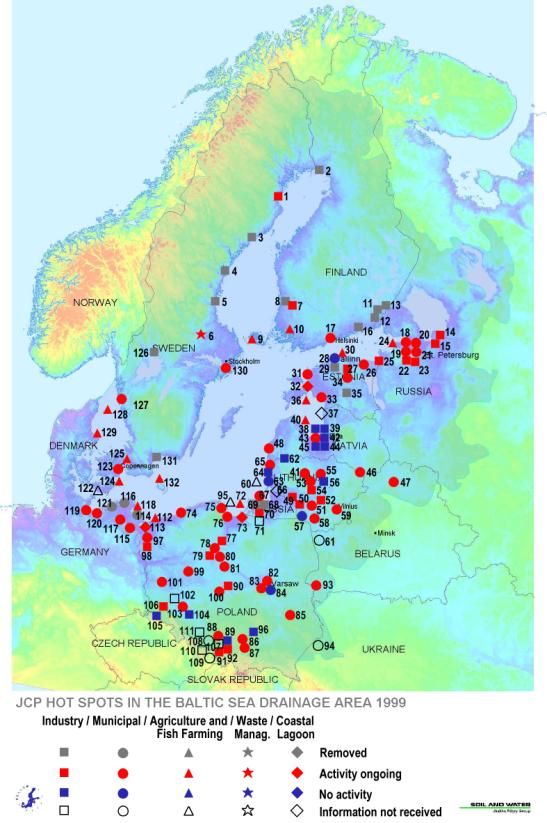
Hot Spots
The Baltic Sea Join Comprehensive Environmental Action Programme (JCP) has identified 132 hot spots in the drainage basin, important to the restoration of the ecology of the Baltic Sea. They include point source pollution from municipal and industrial sources, non-point source pollution from agriculture, rural settlement and transportation, and coastal lagoons and wetland hot spots which include selected coastal areas.
Seventeen of the Hot Spots have been deleted from the list, either because HELCOM recommendations were met or because they were industrial sites that closed for economic reasons.
|
JPC Hot Spots in the Baltic Sea Drainage Area 1999
|
|
|
Source: Helsinki Commission, Baltic Marine Environment Protection Commission. Helcom Programme Implementation Task Force. (HELCOM PITF). The Baltic Sea Join Comprehensive Environmental Action Programme, Annual Report 1998
|