1.3 Demography
The total population in the Baltic Sea region (BSR) of about 103 million has changed only little during the entire 1990s.
| Population of BSR countries in 1998 (in 1,000) |
| Country |
total |
of which in BSR |
| Belarus |
10,200 |
| Denmark |
5,300 |
| Estonia |
1,400 |
| Finland |
5,200 |
| Germany |
80,900 |
12,300 |
| Latvia |
2,400 |
| Lithuania |
3,700 |
| Norway |
4,400 |
| Poland |
38,700 |
| Russian Federation |
146,300 |
10,700 |
| Sweden |
8,900 |
| T o t a l |
307,500 |
103,200 |
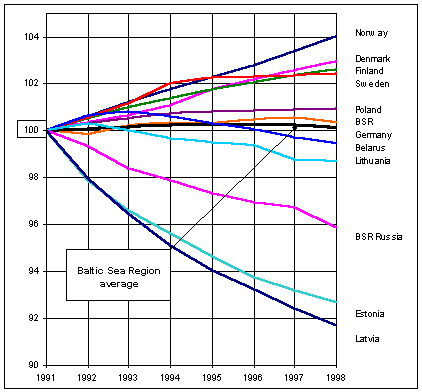
Total population growth was just 0.2% during the period, less than in the European Union (more than 2% during the same period). But differences between countries/regions are substantial.
Population has increased in Norway with as much as 4% between 1991 and 1998, and in Denmark, Finland and Sweden around 2-3%. Population growth was smaller in Poland (0.9%) and the Baltic Sea parts of Germany (0.3%).
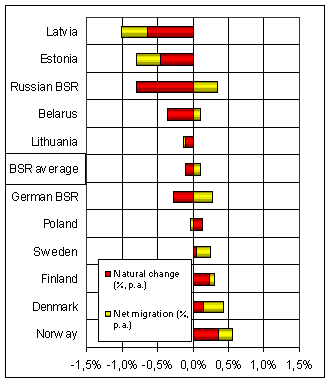
In Norway and Finland this increase is mainly due to relatively high birth rates. In Denmark and Sweden population has increased mostly from international immigration.
Despite an increasing migration surplus in Belarus, population trends turned negative after 1993.
Unlike the other two Baltic States, population in Lithuania has decreased only modestly (1.3%) during the 1990s. International emigration from Lithuania has not been as significant during the 1990s as in Estonia and Latvia, due to a lower share of Russian minorities in Lithuania (8%).
|
Natural demographic change and net migration
per 100 population (%) - annual average rates 1994-98
|

|
|
Source: Nordregio based on national statistics
|
Population has decreased significantly in all Russian BSR regions (by 4.1% between 1991 and 1998). Natural decrease was nearly 0.9% annually (!) between 1994-96 and still almost 0.7% in 1997-98. In absolute terms there were nearly 200,000 fewer births than deaths in St Petersburg 1994-98. The corresponding number for Leningrad oblast was more than 80,000. High immigration rates have not balanced this massive natural decrease.
|
Population change in the BSR 1991-98, index 1991=100
|

|
|
Source: Nordregio based on national statistics
|
The development in Estonia and Latvia was even more dramatic. Population decline in Latvia between 1991 and 1998 was more than 8% and over 7% in Estonia. Most of this was emigration to the former CIS. Despite a slow-down of the population decline in the late 1990s (with decreasing emigration), natural population decline continues to be high - approx. 15,000 persons annually in Latvia and between 6,000-7,000 in Estonia.
Ageing
There is an overall trend towards an ageing population - growing share of the elderly, reducing share of younger population.
By the year 2001 the German working age population will start to decrease in absolute number. Other countries will follow later.
The ageing process is faster in sub-regions with higher-than-average population decline. While capitals and other major cities benefit from in-migration of the younger, the population in rural areas (with declining agriculture employment) and in declining industrial areas outside large cities is getting older. Public transport, in such declining-ageing areas becomes simultaneously more necessary and less financially viable. Education facilities then tend to be improved rather in migration destination areas. All this reduces the innovation and growth potential of disadvantaged areas, ending up in a negative cycle.
|
Trade flows in the Baltic Sea Region 1998
|

|
|
Note: Trade flows show the sum of both directions, based on reported exports by origin country. Data source: IMF (1999).
|

